Analytics Overview
Late last summer the good folks at MSN invited me to give a talk on “Conducting Effective Market Landscape Assessments and Intelligence Gathering” where I discussed techniques for gathering competitive intelligence for MSN.com. One of the important topics I covered was how analytics–research based on observational data gathering–is critical to understanding visitor and market behavior.
There are actually a few types of analytics. Web Server Log Reports (site statistics) are the oldest form of analytics, typified by products like WebTrends and a host of Open Source products like AWStats. These systems report on the data collected in log files maintained by your webserver, logs that track the time and date stamp of every web page and every image served up by the webserver.
Site stats deliver reports such as most popular pages on your site, top entry pages, top exit pages, overall pages served, and overall number of “hits” (the number of resources served by the webserver, now considered an almost meaningless metric, since these days a single web page with 4 javascript calls and 12 images represents 17 hits).
Path Analysis is used to track every individual who comes to a site, and every page they visit. This type of analysis, performed by products like Adobe/Omniture SiteCatalyst and iMedia Analytics, collects a lot of data and delivers a lot of intelligence, including:
- heat maps, reports that tell you which links on any given page are getting the most clicks,
- page-dotting, the tracking of every variable in the visitor’s web site session, which can tell you things like which items they abandoned in their shopping cart,
- click-path analysis, or the most common paths that users are taking through your site, providing insights into things like user interface strengths and deficiencies, and
- real-time story trending, the ability to see almost instantly which of your stories is “going viral” and which are languishing.
Another category is what I call Broad-spectrum External Analytics, which collect a certain amount of page data (generally less than the other methods, but still enough to deliver powerful reports), by adding a bit of code to your web page that sends data to an external, third party system (like Google Analytics or Alexa). The third party system then correlates that data against more general data that they have unique access to, like comparative metrics of other sites.
The ability to correlate external data across the Internet enables some of these external analytics engines, like Radian6 and Nielsen BuzzMetrics, to specialize in social analytics, monitoring the social media conversations across thousands of sites. These will tell you if your stories or your brand are going viral, and where.
Google Analytics
But to many newsrooms, analytics is almost synonymous with Google Analytics, or GA, the (currently) free service provided by Google. GA provides a great deal of useful information, and you can’t beat the price!
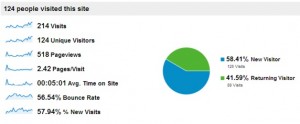
Here is a report from the first days after launching Blogging Writes. As you can see, I received 214 visits, from 124 unique visitors. This means that they were uniquely identified by GA by their IP address and computer hostname–just some of the data that Google collects. Of course, if someone read a posting at work, and then that same person went home and read another posting, they would be counted as two unique visitors.
The report also shows that I’m getting over 40% repeat visitors (not bad for a brand-new blog) and that readers spend an average of five minutes on the site. So far so good.
Pageviews is the number of pages that were viewed during the time period. This may seem straightforward, but in a news site, it isn’t always. Pageviews are triggered by the Google Analytics code that is put into every web page. But on a news site, a clever tech team will also have each photo image in a slideshow trigger a new pageview, even though the slideshow may display to the visitor as a new layer on the existing page (this is called an interstitial page). Other items on the page can also trigger page views, such as embedded Flash interactives (especially those in iFrames) and interstitial popups that show third-party aggregated content.
The Bounce Rate is a measure of how many people leave the site after visiting only one page. In a new blog, where all the postings are concatenated on the first page, the bounce rate is all but meaningless. But in a news site, where most traffic comes to individual stories, it is critical as it shows whether you are drawing visitors to additional stories. Ideally, you want visitors in a news site to view at least 5 stories (pages) per visit.
% New Visits is a metric of overall growth, suggesting that the site is growing with new readership. In a brand new site like this one, you want a good balance. But in a news site that has been around a while, you hope for visitor loyalty (a high percentage of return visitors) to eventually overshadow new visitors, as you start to saturate your market.
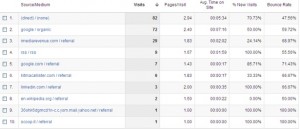
I can also see a map of where in the world the visitors come from, how they came to the site, and even which pages they viewed (the page identified as / means the home page).
Once you get past the basics of page tracking, you can move on to track certain “click events” performed by your visitors (this is known as “event tracking”). For example, in a web site I did for Roadside Attractions Films, http://conspiratorthemovie.com/, I put in a bit of extra Google Analytics code to track each time a visitor clicked on the movie trailer. I also coded the end of the trailer as a javascript-based event. These events show up in the Google Analytics reports, telling me not only what percentage of visitors watched the trailer, but also how many watched it to completion.
Google Analytics shows a dizzying array of reports, and you can do your own drill-downs and pivots to gain the most amazing insights. Lets look at a slightly more complex example from a high-traffic news site, and see what we can learn:
May-June 2011 Report on a Popular News Site
- Page Views: 7,854,458, Visits: 1,546,462 (5 average pageviews/visitor)
- Home Page Views: 117,441 (1.5%)
- Overall direct landings: 1,540,243
- Home page direct landings: 68,350 (4.4%) with a 40% bounce rate
- Visited home page after any other page: 49,091 (0.625%)
- Number of total pages viewed: 35,616
- Top 9 most popular pages represent 3,334,877 views (42.5%)
- Top 9 most popular pages are all older than 10 days (only 4 stories from May 2011)
- Average time on page was not correlated by date (no trend one way or another).
- Most popular page (14.11%) is from 09/28/1010
- All topic pages together totaled only 29,353 views (0.37%)
Conclusions:
- Over 95% of visitors do not arrive via the home page.
- Only 3% of visitors subsequently visit the home page.
- Topic pages are very rarely viewed (one-third of 1% of traffic).
- Navigation from the story pages is critical to optimize, as these are the real entry pages.
- Timeliness is not the main driver. Pages over 2 weeks old continue to lead traffic.
- Traffic to older pages did as well as traffic to new pages.
- “Long tail of the comet” traffic patterns, suggesting that older stories are important to retain as permalinks.
This analysis enabled me to determine that the home page in a news site is grossly overrated, that story pages are the main entry points, and that story page templates need to be optimized to serve as guides that introduce you to other pages in the site.
The moral of the story? Free tools like Google Analytics will tell you a lot about your site, your stories, traffic sources, visitor demographics, visitor loyalty, average time spent on the site, and can provide keen competitive and marketing intelligence insights.
Of course, there are analytics tools that can take you even farther. Real-time reporting lets the newsroom see how stories are faring the moment they are out of the gate. Path analysis tools show precisely how users move through your site, giving you deeper insights into how to optimize your site for the best user experience, increased traffic, increased time-on-site, and increased page views, all of which generally translates to increased revenue. These more advanced tools generally come with a price tag, but can be worth their weight in new subscribers.


